Dashboards
Give every team the view they need
Build dashboards around incidents, errors, performance, and operational trends. Engineers get the detail they work from, and leadership gets to see how production is doing without opening a single incident.
Visibility for the people who aren't paged
The engineer on call needs to know where to look. The person who runs the team, or approves the tools it uses, needs something else: what is happening across our applications, are incidents getting better or worse, and which applications are causing the most pain. A dashboard answers those without anyone opening an incident. Count incidents over time, break them down by severity or by application, and show how long they take to resolve, next to the error and performance trends behind them.
Nothing on a dashboard is entered by hand. It counts the same errors, incidents, and timings your engineers investigate from, so the picture leadership sees and the detail an engineer works in are two views of one record. Build one dashboard for the on-call rotation, one for each team's own application, and one for the people who need the summary.
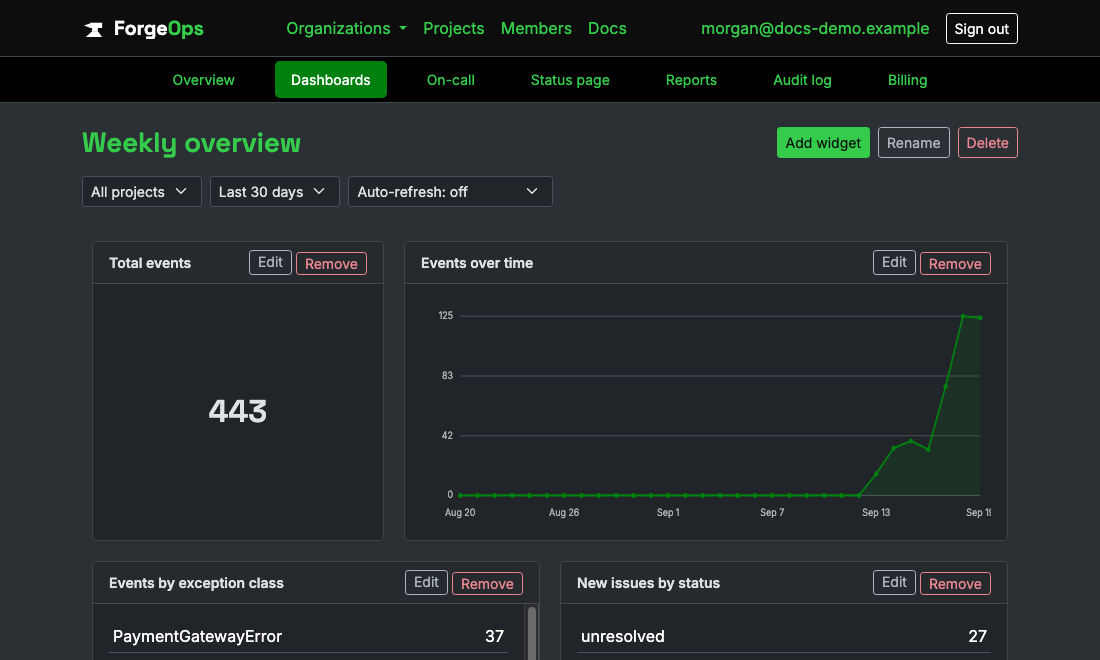
Every widget picks its own data source, display type, and filters.
Flexible, but never a raw column name
A widget picks a data source (events, new issues, heartbeat/uptime incidents, notification deliveries, tickets filed, or the audit log), how to display it (a big number, a chart over time, or a table grouped by whatever dimension that source offers), and optional filters specific to that source. Any combination is valid: a rich, bounded vocabulary rather than raw SQL.
The safety boundary lives in the query engine itself, not the form: every data source explicitly enumerates exactly which columns it can be grouped or filtered by, and that same list is checked again when a widget is saved, at the model layer. Nothing a widget's own config carries ever reaches a database query as a caller-supplied column name, only a value already checked against that source's own allowlist.
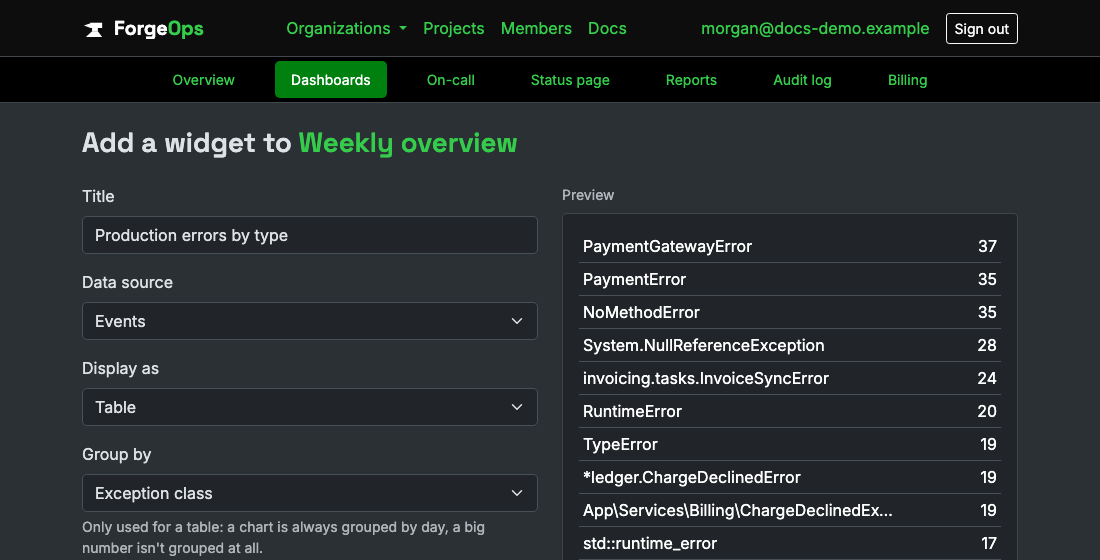
The builder live-previews a widget as you configure it.
A real drag-and-drop grid
Widgets aren't stacked in a fixed order; each one carries its own position and size, dragged and resized freely on a 12-column grid. Every drag or resize saves the whole layout in one request, not one per widget moved, so rearranging several widgets at once still costs a single round trip.
A viewer sees the exact same grid an admin does, just without the drag/resize handles: read-only, not a different, simplified layout.
Every plan, just capped differently
Enforced at the model layer, the same unbypassable pattern every other gated feature in this app uses: a dashboard simply can't be saved once an organization is already at its own plan's own cap, checked on every create regardless of which path in the app tries it. Free stops at 5, Pro at 15, Business and Enterprise don't stop at all.
See it on your own data
Free plan included, no credit card required. New organizations start with 14 days of Business.
Get started freeGet