Ruby on Rails error tracking
Know when your Ruby on Rails app breaks, before your users do
ForgeOps connects the errors your Ruby on Rails app reports to the deploys, traces, and changes around them, so when production breaks, the incident already says who's affected, what changed, and where to look.
Hooks Rails.error automatically, no further wiring needed. Running on ForgeOps' own dedicated infrastructure, so nothing about a Ruby on Rails app's errors or its users' data gets routed through a third-party error-tracking vendor. See an incident investigated →
Get ForgeOps running in 5 minutes
Connect your Ruby on Rails application, trigger a test exception, and see it appear in ForgeOps.
1Install
gem "forge_ops_tracker"
File: Gemfile
2Configure
ForgeOpsTracker.configure do |config|
  config.dsn = ENV.fetch("FORGE_OPS_DSN")
end
File: config/initializers/forge_ops_tracker.rb
3Send a test error
FORGE_OPS_ENVIRONMENT=production bin/rails runner 'Rails.error.report(RuntimeError.new("ForgeOps test error"))'
Run this from your app's own root, with FORGE_OPS_DSN set. bin/rails runner starts in development, which doesn't send (only production and staging do), so FORGE_OPS_ENVIRONMENT=production sends this one test from your machine. Without it, the gem prints a one-line Not sending warning at boot instead.
4Watch it arrive
Create a free project to test this live.
Create a project →Create5View the issue
Open your project's Issues page. You should see ForgeOps test error, grouped and ready to acknowledge, assign, or connect to an alert.
6Automatic capture
That's it: every unhandled exception in a request, a background job, or a console session already reports automatically from here on. This client hooks Rails.error directly, the same reporter API Rails itself uses internally, so there's no middleware to add and nothing further to wire up.
7Handled exceptions
For an exception your own code already rescues (one you don't want to re-raise, but still want tracked), report it explicitly with handled: true, so ForgeOps can tell the two apart:
begin
  risky_operation
rescue StandardError => e
  Rails.error.report(e, handled: true)
end
8Background jobs
Sidekiq (7.1+) forwards job exceptions through Rails.error automatically, the same reporter API above, so a failing background job becomes a ForgeOps issue exactly the way a failing request does (from forge_ops_tracker 0.10.1 on, carrying the real error rather than Sidekiq's internal retry wrapper). Solid Queue and Clockwork don't forward through Rails.error on their own, so each needs one small, one-time hook instead:
# app/jobs/application_job.rb
rescue_from(StandardError) do |exception|
  Rails.error.report(exception)
  raise exception
end

# config/clock.rb (Clockwork, not ActiveJob)
Clockwork.error_handler do |error|
  Rails.error.report(error)
end
9Production configuration
environment comes from FORGE_OPS_ENVIRONMENT, then Rails.env, so there's nothing to set there; release is the one thing worth adding before you actually ship, so issues group correctly by the version that introduced them and Releases/regression detection have something real to key off of:
ForgeOpsTracker.configure do |config|
  config.dsn = ENV.fetch("FORGE_OPS_DSN")
  config.release = ENV["HEROKU_SLUG_COMMIT"] || `git rev-parse HEAD`.strip
end
10Troubleshooting
Events aren't appearing?
Events aren't showing up?
Confirm FORGE_OPS_DSN is actually set in the environment your app is running in, not just locally; ForgeOpsTracker.configuration.enabled? is false with no DSN, and every capture becomes a silent no-op rather than an error.
Check your application logs.
A failed delivery logs a line starting "[ForgeOpsTracker]" to Rails.logger; look for one around the time you triggered the test error.
Restart your application.
An environment variable set after the app already booted won't take effect until the next restart; this trips people up most often right after adding FORGE_OPS_DSN for the first time.
Verify outbound HTTPS connectivity.
The ingestion host has to be reachable from wherever your app actually runs (a container, a server behind an egress proxy), not just from your own laptop.
Check you're looking at the right project.
Each project has its own DSN; a DSN copied from a different project's settings page will never show events on this one.
Works with your framework
The Ruby on Rails client hooks in at the framework level, not by wrapping individual calls, so nothing about how you already write Ruby on Rails code has to change.
Rails 6.1+
Hooks Rails.error directly, the same reporter API Rails itself uses internally, no middleware to add.
Sinatra
Add use ForgeOpsTracker::Middleware::RequestContext after ForgeOpsTracker.configure: it reports an exception that escapes a request, and in production one Sinatra already turned into a 500 page. Needs forge_ops_tracker 0.16.0.
Plain Rack apps
The same middleware works for anything that speaks Rack, framework or not, and ForgeOpsTracker.capture_exception(error, context: {}) reports one you rescue. Needs 0.16.0.
What it looks like
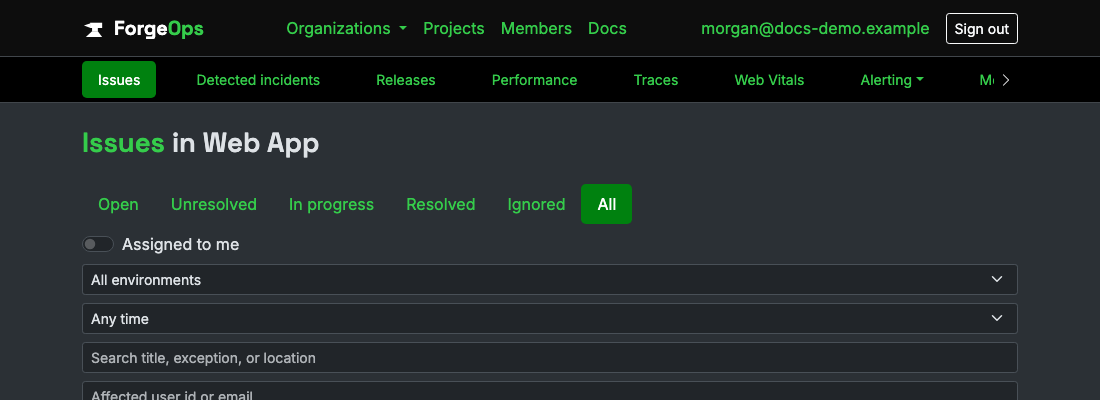
The issue list
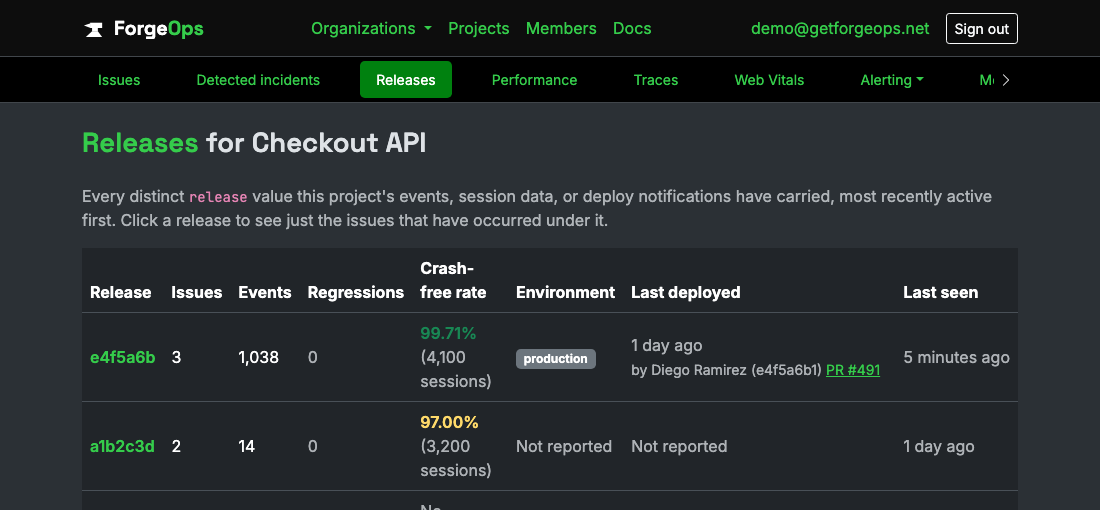
Every Ruby on Rails issue reported into a project shows up here: title, status, assignee, event count, and when it was last seen, the same columns as any other language's project.
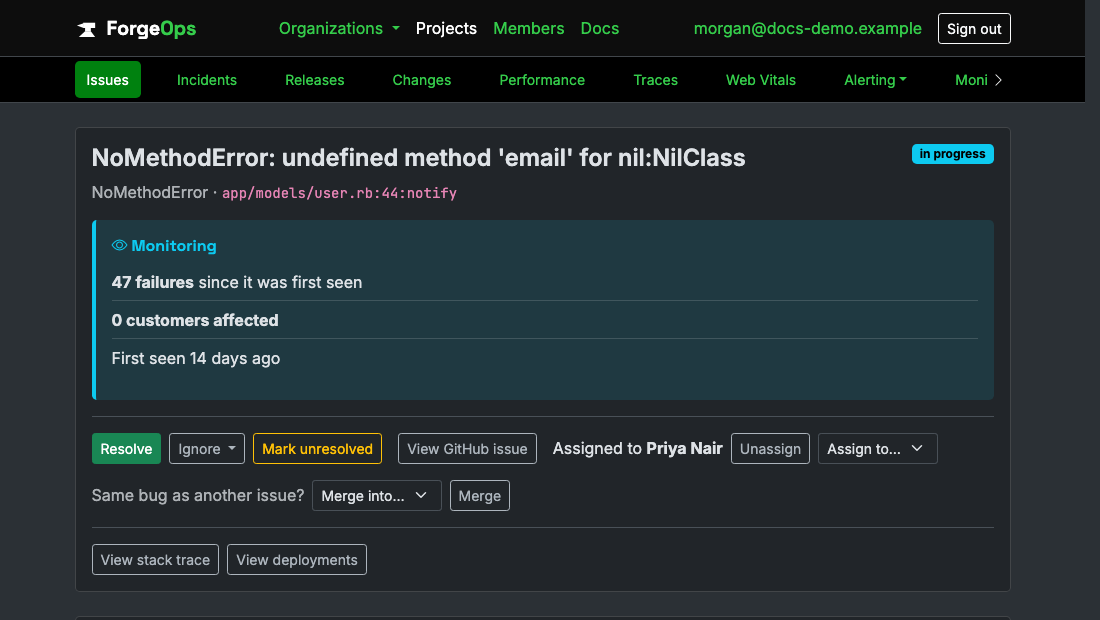
The issue detail
Every occurrence keeps its own timestamp, environment, release, and server, plus the backtrace exactly as Ruby on Rails reported it, expandable per occurrence rather than flattened into one generic stack.
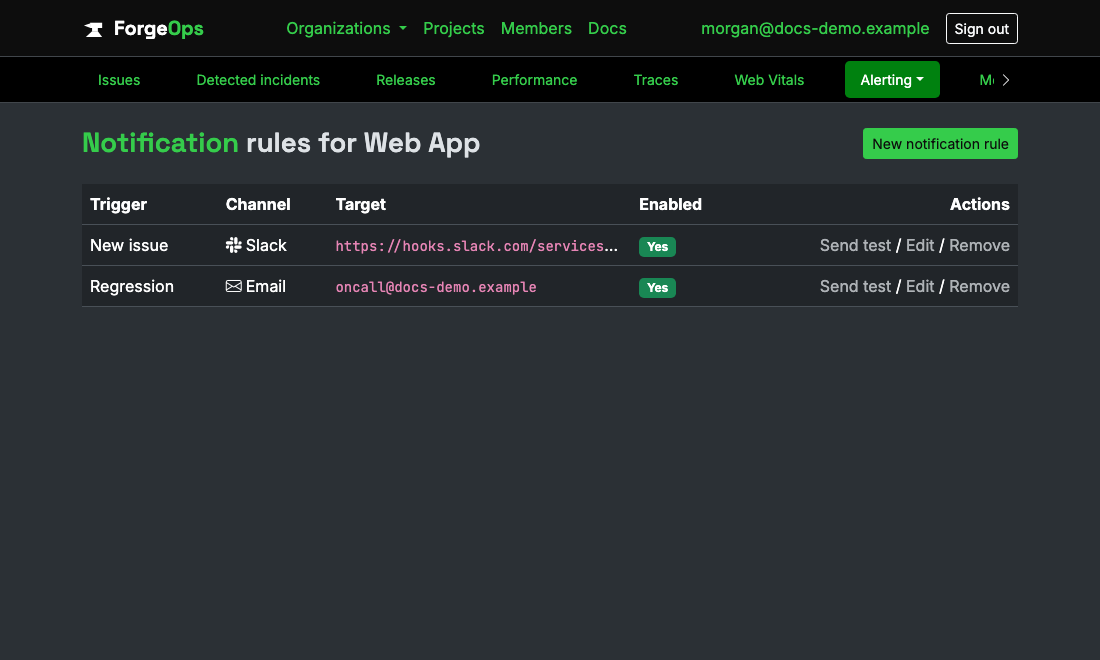
Alerting
A new Ruby on Rails issue, a regression, or a spike past a threshold you set can reach Slack, Microsoft Teams, email, PagerDuty, Opsgenie, or a generic webhook, configured per project, per trigger.
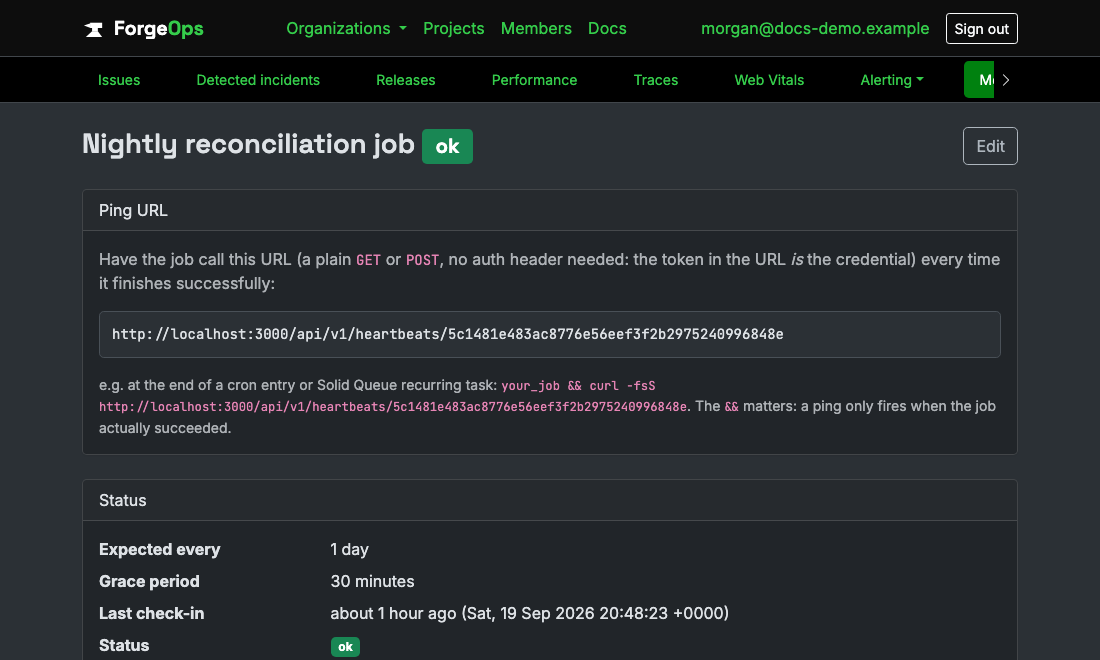
Heartbeats
For the failure mode error tracking can't see on its own: a Ruby on Rails cron job or recurring task that's supposed to run but silently stopped. Each heartbeat gets its own ping URL and its own grace period before it alerts.
Release health
Once your app is reporting into ForgeOps, every request also counts as a session: crash-free unless an unhandled exception actually escaped it. That gives each release's row on a project's Releases page a real crash-free rate, not just an event count. On by default in forge_ops_tracker 0.4.0+, the same "on unless you turn it off" default error tracking itself already has; requests are counted in-process and flushed as one small aggregate report every 60 seconds, not one network call per request. Requires a plan that includes release health; on a plan that doesn't, the periodic reports are accepted but not recorded (the response says why), so a working setup never looks broken.
ForgeOpsTracker.configure do |config|
  config.track_sessions = false      # opt out entirely
  config.session_flush_interval = 30 # seconds; default 60
end
Performance monitoring
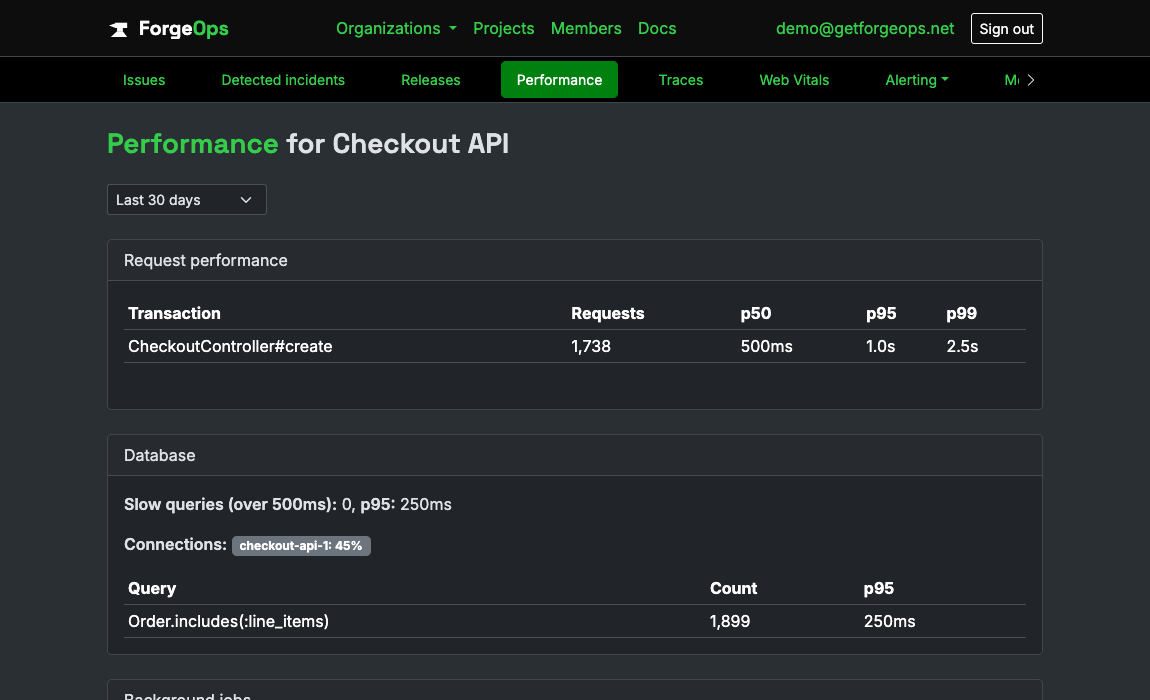
Every request's controller/action duration is timed too, via Rails' own process_action.action_controller instrumentation (no extra middleware needed), so a dashboard widget can show which parts of your app are actually slow, not just which ones raise. On by default, bucketed by transaction and flushed as a small periodic aggregate per transaction every 60 seconds, the same delivery philosophy as release health above. The same automatic instrumentation also covers database queries, background jobs (any Active Job backend, Solid Queue included, plus raw Sidekiq workers), outbound Net::HTTP calls, and, when they're already loaded, Sidekiq/Solid Queue/Puma's own operational gauges (queue depth, worker counts, Puma's thread pool); see the gem's own README for the full list. Requires a plan that includes performance monitoring; on a plan that doesn't, the periodic reports are accepted but not recorded (the response says why), so a working setup never looks broken. Each report also carries a small latency histogram (forge_ops_tracker 0.9.0 and later), so ForgeOps shows an approximate p50/p95/p99 per transaction, not just an average, accurate to the width of the latency bucket a duration falls into.
ForgeOpsTracker.configure do |config|
  config.track_performance = false       # opt out entirely
  config.performance_flush_interval = 30 # seconds; default 60
end
Renamed or removed background jobs
Renaming or removing a job class breaks every job still queued under the old name, and no test can catch it, because those jobs live in Redis, not your repo. Sidekiq stores the class name as a string, so each job fails the moment a worker picks it up, and one waiting on a retry backoff fails hours after the deploy. ForgeOps recognizes this failure, whether it comes from an Active Job job or a plain Sidekiq one: the issue names the class that no longer exists and says how soon after which release it first appeared, and your new-issue alerts carry the same explanation. Active Job jobs need forge_ops_tracker 0.10.1 or later to be reported this way. The fix is to keep the old name as an alias until the queue, retry set and scheduled set have drained:
# app/jobs/send_invoice_job.rb
# Kept only until jobs queued under the old name have drained, then delete this file.
SendInvoiceJob = DeliverInvoiceJob
Custom metrics
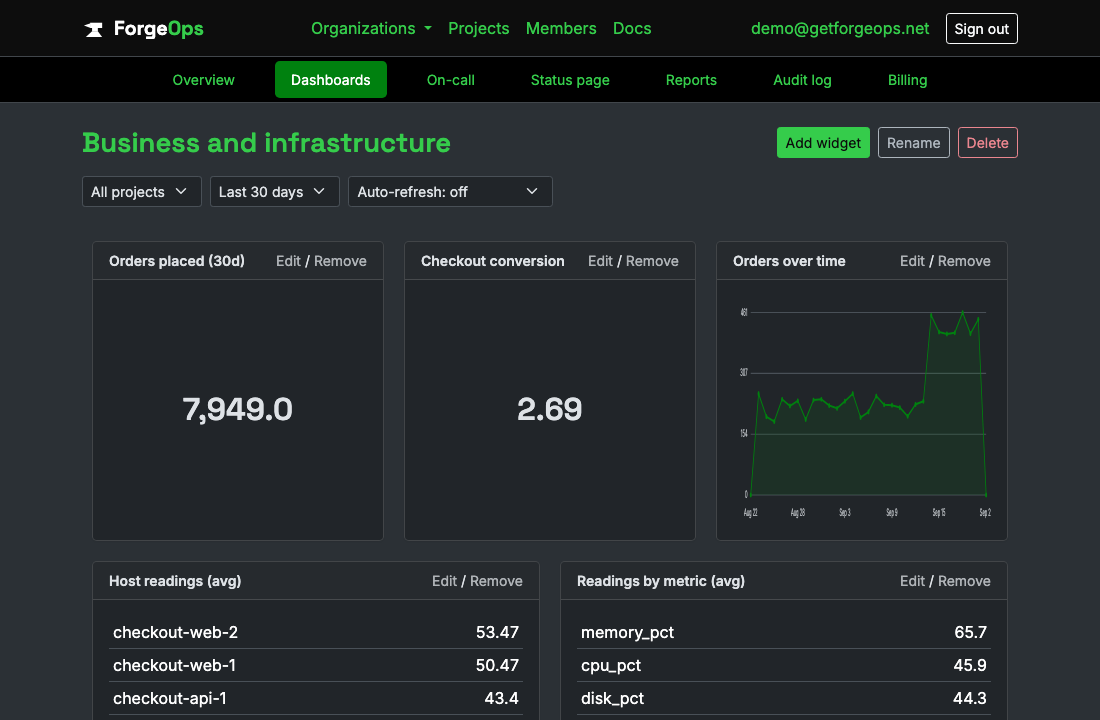
Track any named business metric, a signup, a payment, anything you want to call it, with a single explicit call. value defaults to 1.0 so a bare counter-style call needs no argument at all; pass one for a metric with a real amount. Buffered and flushed as a batch on a background thread, same delivery philosophy as everything else in this gem, so this is safe to call from inside a request (right after a signup completes, say) without adding network latency there. Requires a plan that includes custom metrics.
ForgeOpsTracker.capture_metric("signups")
ForgeOpsTracker.capture_metric("revenue", value: 49.00)
Infrastructure monitoring
Report CPU/memory/disk (or anything else you can read) from your own servers, on your own schedule, not a ForgeOps-built agent. Drop a small script like this into a cron entry or a systemd timer; hostname defaults to the box the script is actually running on. Buffered and flushed on exit, so a handful of capture calls in one short-lived process still cost one network request, not several. Requires a plan that includes infrastructure monitoring.
# A cron entry or systemd timer runs this periodically, not your web app itself.
require "forge_ops_tracker"
ForgeOpsTracker.configure { |config| config.dsn = ENV["FORGE_OPS_DSN"] }

load_average = File.read("/proc/loadavg").split.first.to_f
ForgeOpsTracker.capture_infrastructure_metric("load_average", value: load_average)

meminfo = File.read("/proc/meminfo").lines.to_h { |line| line.split(":").map(&:strip) }
total_kb, available_kb = meminfo["MemTotal"].to_i, meminfo["MemAvailable"].to_i
ForgeOpsTracker.capture_infrastructure_metric("memory_used_percent",
  value: 100.0 * (total_kb - available_kb) / total_kb)

disk_used_percent = `df --output=pcent / | tail -1`.strip.delete("%").to_f
ForgeOpsTracker.capture_infrastructure_metric("disk_used_percent", value: disk_used_percent)
Distributed tracing
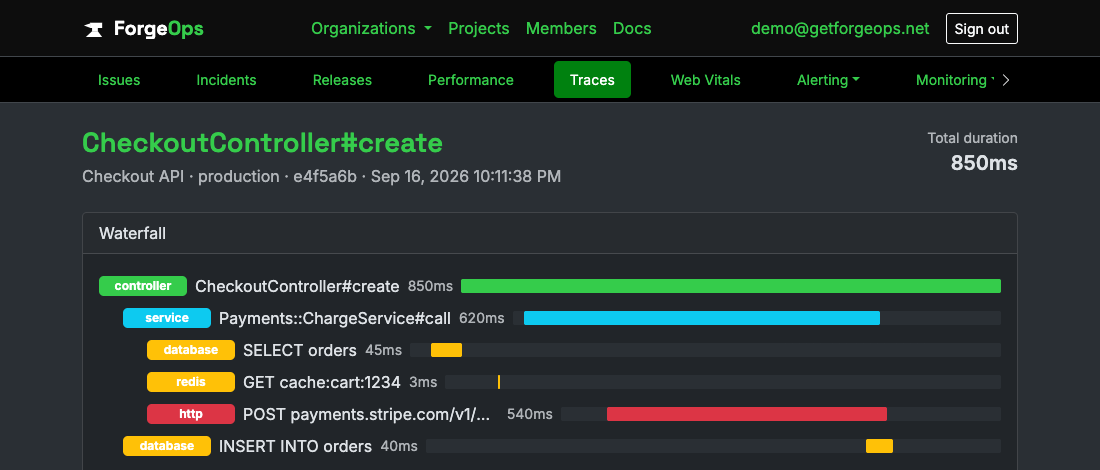
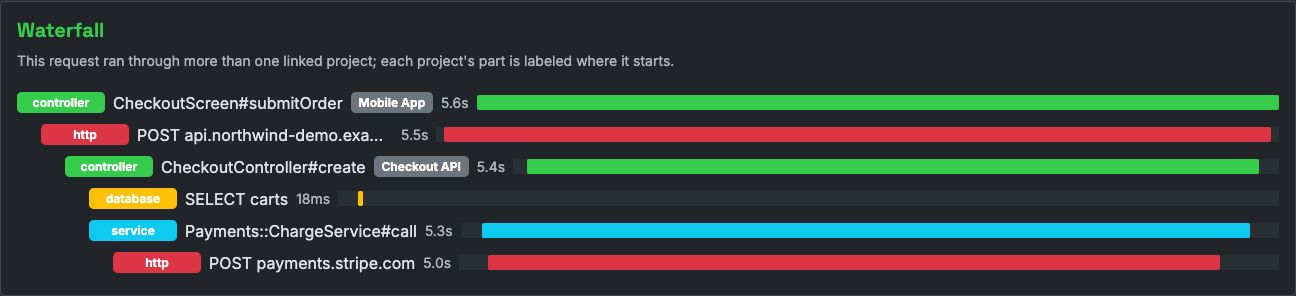
Every request is traced automatically, along with its database queries and outbound Net::HTTP calls, so ForgeOps can render a waterfall for one slow request. Only a slow request's trace is ever sent: whether it crossed the threshold (one second by default, configurable) is decided entirely inside your process, so a fast request costs nothing over the wire. Wrap your own service-layer code in a span to have it show up as its own step in that waterfall. Outside a traced request it simply runs the block. Requires a plan that includes distributed tracing.
ForgeOpsTracker.span("PaymentService.charge") { PaymentService.charge(order) }
ForgeOpsTracker.span("fetch rates", kind: "http", data: { host: "rates.example.com" }) { fetch_rates }

ForgeOpsTracker.configure do |config|
  config.track_tracing = false             # opt out entirely
  config.trace_capture_threshold_ms = 500  # default 1000
end
Errors now carry the request they happened in: its endpoint (POST /checkout) and its trace id. An issue names its affected endpoint, each occurrence links to its exact trace, and a request that fails is always traced, however fast. The trace follows the request across services in the standard traceparent header, picked up from whatever called this app and passed on to whatever it calls over Net::HTTP, so once the projects are linked in ForgeOps an error shows the errors another project raised in the same request. Needs forge_ops_tracker 0.12.0.
ForgeOpsTracker.configure do |config|
  config.propagate_traces = true                           # the default
  config.trace_propagation_targets = [ "api.example.com" ] # only these hosts; nil (the default) means all
end
SQL in a request
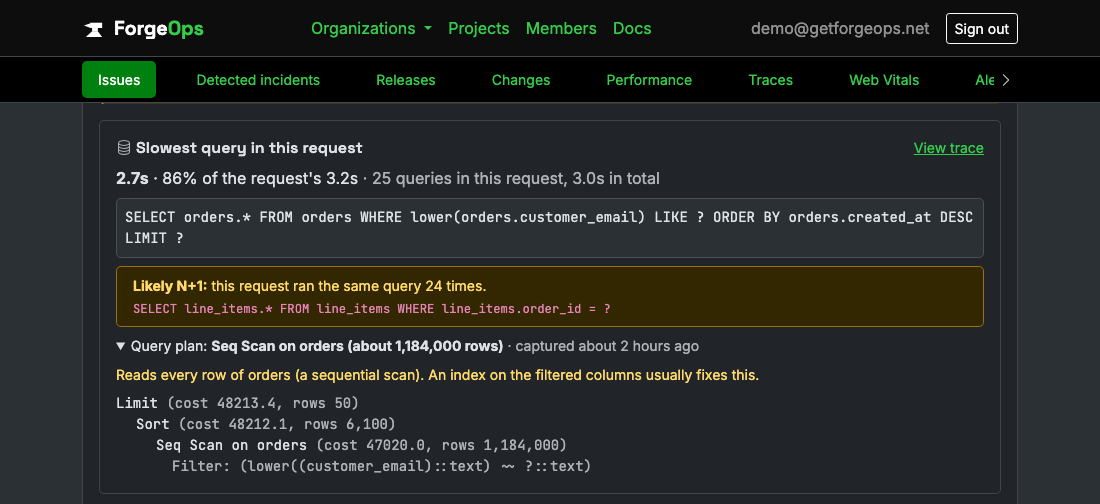
When the request an issue failed in was traced, the issue opens with its slowest query: how long it took, its share of the request's time, how many queries the request ran, and a likely N+1 warning when the same statement ran five or more times. Every Active Record query span already carries its SQL, masked so every string and number becomes a question mark and bind values are never sent, with nothing to add. Turn on explain_slow_queries and a slow SELECT on PostgreSQL gets its plan too, shown beside the query with any sequential scan over a large table pointed out; it runs plain EXPLAIN, never EXPLAIN ANALYZE, and only for a single plain SELECT, off the request on its own connection inside a read-only transaction with a two second timeout, at most once per statement every ten minutes. Needs forge_ops_tracker 0.14.0; plans need a plan that includes performance monitoring.
ForgeOpsTracker.configure do |config|
  config.explain_slow_queries = true # default false; PostgreSQL only
  config.explain_threshold_ms = 500  # default 500; only queries at least this slow
end
What changed
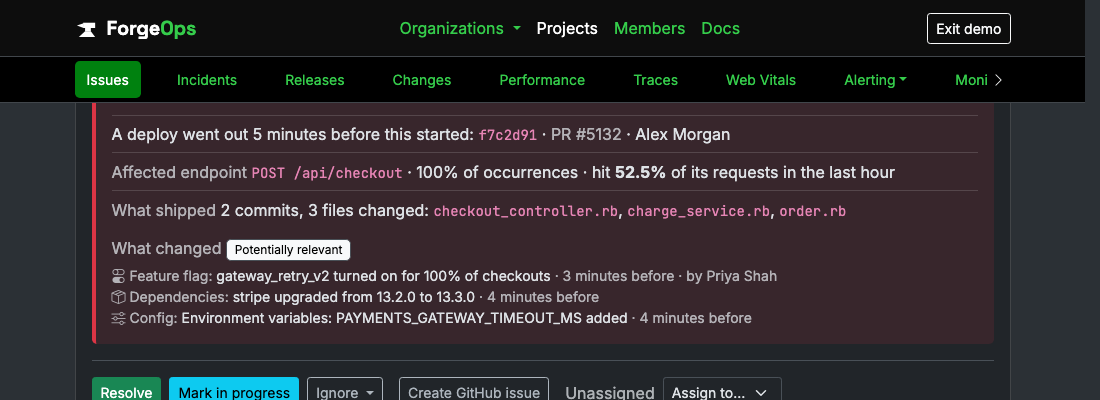
A feature flag flip or a config edit can break things with no deploy at all. Record one with record_change and it shows under What changed on any issue that starts in the next two hours, and on the project's Changes page beside your deploys, labeled potentially relevant, never as the cause. Changes between deploys are detected for you: once per process, after Rails boots, the gem sends the Ruby version, every gem in Gemfile.lock, and the schema migration version, so a gem upgrade or a new migration shows up with nothing to call. Environment variable names (never values) are opt-in. Needs forge_ops_tracker 0.13.0, on a plan that includes change tracking.
ForgeOpsTracker.configure do |config|
  config.detect_changes = true      # the default; false sends no startup snapshot
  config.track_env_var_names = true # default false; names only, never values
end

ForgeOpsTracker.record_change(
  kind: "feature_flag",
  title: "gateway_retry_v2 turned on for 100% of checkouts",
  details: { flag: "gateway_retry_v2", from: "10%", to: "100%" },
  actor: current_user.email
)
Database errors
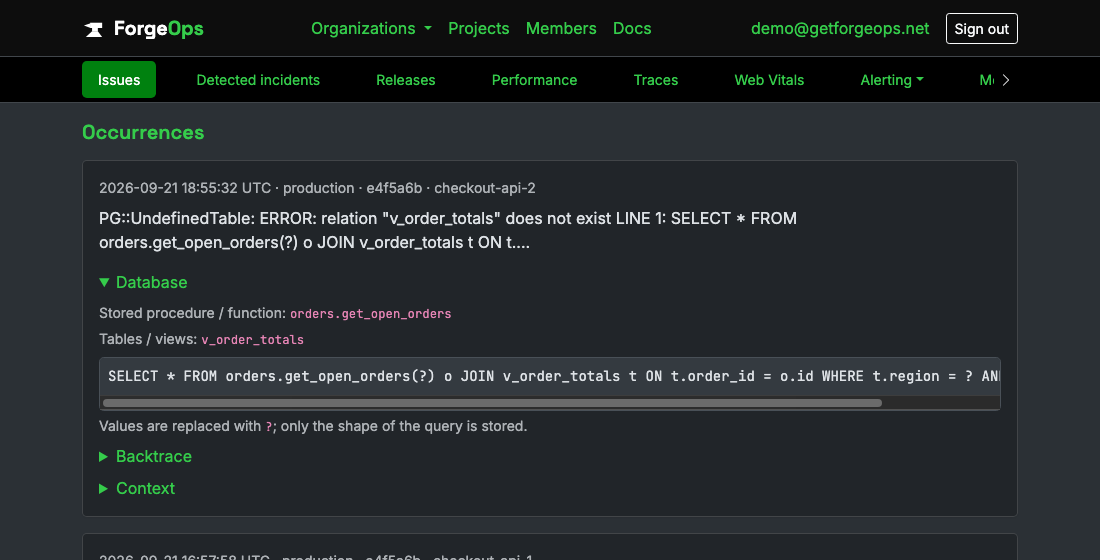
When an error comes from a database call, the issue shows which stored procedure, table or view its SQL touched, so you know where to start looking. Rails reads the statement straight off ActiveRecord::StatementInvalid, or off the error it wraps, with nothing to add. The names are sent by default and are identifiers, never values. The SQL statement itself is opt-in, with every string and number replaced by a question mark before it leaves your app, and a project setting can stop ForgeOps storing the statement at all.
ForgeOpsTracker.configure do |config|
  config.capture_sql_statement = true # default false
  # config.capture_sql_objects = false # default true; false stops even the names
end
Questions
Do I need to change how I already handle errors?
Almost never. Every client hooks the framework's own exception handling directly, the same way the install snippet above shows, so your own logs, error pages, and rescue blocks keep working exactly as they did before, and ForgeOps just also finds out about it. The one common exception is a background-job runner that doesn't forward through that same mechanism on its own; that needs one small hook added instead, not a change to anything already there.
Where does the data actually go?
Straight to ForgeOps' own ingestion API over plain HTTPS. No agent, no sidecar, and no third-party ingestion service in between, so nothing about your app's traffic or its users' data gets routed through anyone else's pipeline first.
What happens if the same bug fires a thousand times?
It's fingerprinted from its exception class, message, and backtrace, so a thousand reports of the same bug still show up as one issue with an event count of 1,000, not a thousand separate rows to dig through. And a runaway loop can't use up your monthly event quota: once one issue repeats faster than your plan's hourly limit (50 an hour on Free), further repeats are still counted, and still count toward spike alerts, but they aren't stored or charged to your quota.
Is anything scrubbed before it's stored?
Yes. Emails, credit card numbers, and known API key/token formats are redacted out of every event before it's even written, on every plan, with room for per-project custom field names on top of the defaults.
Try it with your own Ruby on Rails app
Free plan included, no credit card required. New organizations start with 14 days of Business.
Get started freeGet