Incident investigation for production apps
Know what to investigate when production breaks
ForgeOps connects the signals around a production incident (errors, deploys, changes, customer impact, and traces) and tells you where to investigate next.
No credit card required.
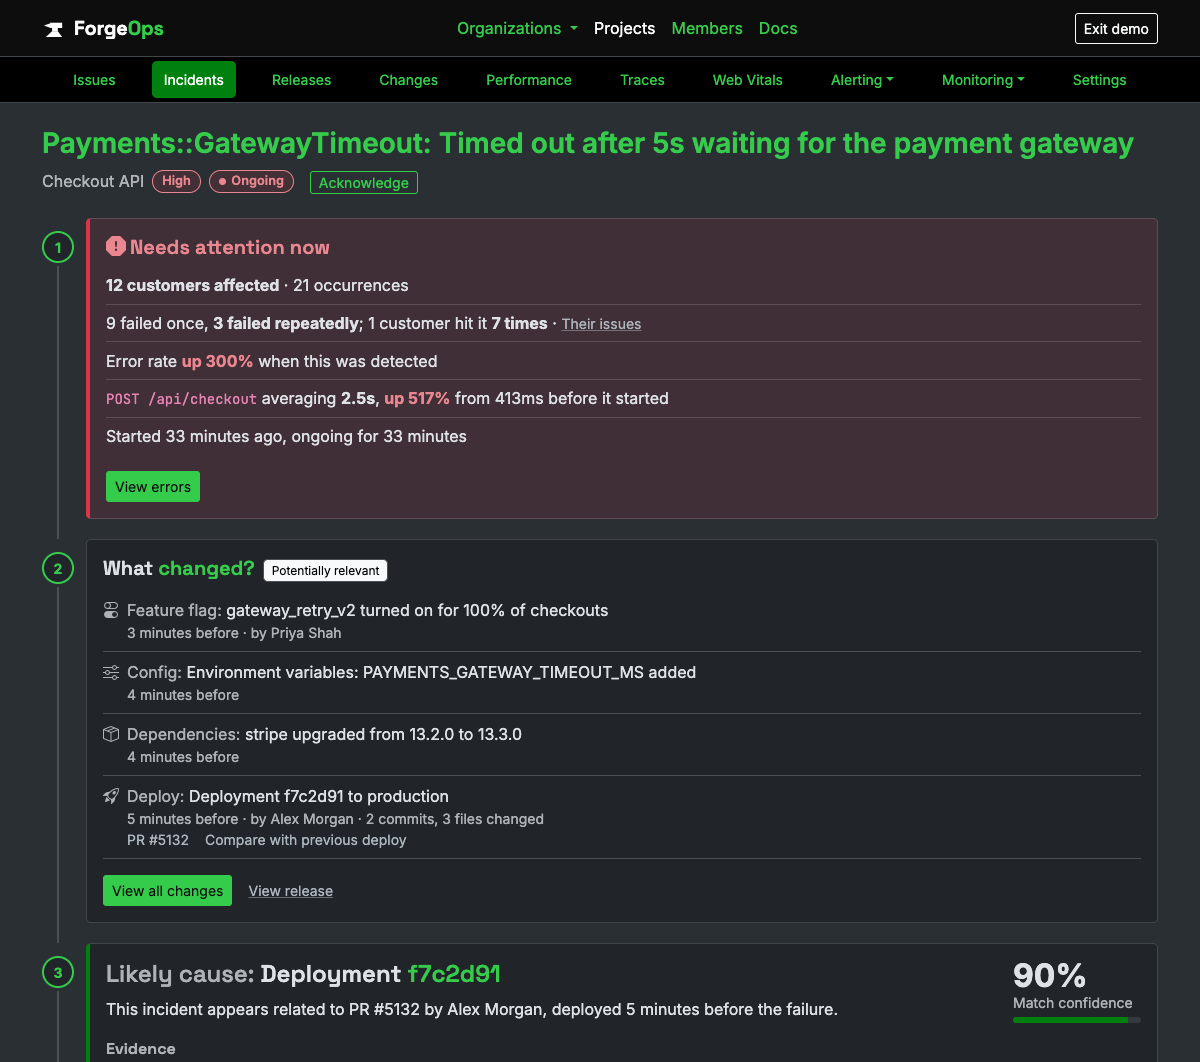
A real incident from the live demo: who it's hitting, what changed just before it, and the likely cause. Explore this in the demo →
Watch it work when the obvious answer is wrong
A clean demo is the easy case. These are recorded incidents, replayed minute by minute through the same rules a live project gets, where the first answer doesn't hold and the evidence moves it.
Replay 1
The deploy wasn't the problem
A deploy eight minutes before the failures, and the evidence ends up at a slow query instead.
Replay it →Replay 2
Two deploys, and the wrong one looked guilty
Two deploys minutes apart, part of the telemetry missing, and the most recent deploy isn't the one that did it.
Replay it →Your own
An incident your team has already been through
Upload the errors from around it, say what you found, and compare. No account, nothing saved.
Replay yours →What it changes for your team
Your monitoring tells you there was an error. ForgeOps tells you what changed, who was affected, and where to investigate.
Less time finding where to look
An incident opens with what changed just before it, who it's hitting, and a numbered path to the request, query, or service to check first.
One page instead of five tools
Errors, deploys, recorded changes, traces, and customer impact sit on one incident page, so the first minutes go to fixing, not gathering.
Whoever is on call can start
The likely cause comes with its evidence and the pull request behind it, so the person paged can begin even if they didn't write the code.
The write-up is already started
The incident's timeline becomes the postmortem: each deploy, alert, acknowledgment, and recovery, in order, with links to the detail.
And for whoever runs the team
The incidents your engineers investigate add up to a picture you can take to leadership: how many there were, which applications had the most, how quickly they were acknowledged and resolved, how many customers they reached, and whether it's improving. On a dashboard, or as a report in your inbox on a schedule.
How ForgeOps works
Already using Sentry, Honeybadger, Datadog, or Splunk?
Connect it read-only and investigate your next production incident in ForgeOps, without replacing your existing stack or installing anything.
See read-only connections →Starting fresh?
Install the ForgeOps SDK and get errors, traces, deploys, and changes from the first request, in twenty languages.
Pick your language →Connect
Connect the error tracker you already use, read-only, or install the SDK in your application.
Learn more →Investigate
Follow the incident's path: what changed, the likely cause with its evidence, and where to look next.
Learn more →What you actually get
Catch problems before customers report them
Automatically capture and group exceptions across your applications.
Learn more →See what changed
Deploys, feature flags, config, and dependency upgrades from just before a problem started, on the incident itself.
Learn more →Know who's affected
How many customers were hit, how many failed once and how many repeatedly, instead of just error counts.
Learn more →Know where to look next
The likely cause with its evidence, then the trace, the slowest query, and the outside service to check.
Learn more →Respond immediately
Alerts in Slack, Teams, email, PagerDuty, Opsgenie, and webhooks say what's wrong and link straight to the investigation.
Learn more →Know when background jobs stop running
Monitor scheduled jobs and receive alerts when expected activity disappears.
Learn more →From alert to answer
Every incident opens as a numbered path, in the order you'd ask the questions. Each step has one next click, a step with nothing behind it is left out rather than shown empty, and the path ends with the full timeline, every entry linked to its detail.
-
1
Needs attention now
How many customers are affected, how many failed once and how many repeatedly, and how far the error rate and the endpoint's response time moved.
-
2
What changed
Deploys, feature flags, config, and dependency upgrades from the hours before it started, labeled potentially relevant, never called the cause.
-
3
Likely cause, with evidence
What a small set of named rules points at, how confident the match is, and every piece of evidence behind it, with the pull request when it's a deploy. A lead to check, not a confirmed diagnosis.
-
4
The request and its trace
The endpoint the failures came from, how much of its traffic is failing, and the slowest captured request to open.
-
5
The slowest query
The slowest database query in that request and its share of the request's time, with a likely N+1 called out.
-
6
The dependency
The outside service the request was waiting on, with its latency and any failed calls.
An issue opens the same way, with what needs attention now and a numbered list of where to look. Every alert, in Slack, Microsoft Teams, email, PagerDuty, Opsgenie, or a webhook, carries the same verdict and an Investigate in ForgeOps link.
Why ForgeOps
Production monitoring shouldn't just tell you that something broke. Your team shouldn't have to jump between error tracking, deployment systems, logs, uptime monitors, and incident tools just to understand what happened. ForgeOps brings errors, deploys, changes, and traces together around the incident, and points you at where to look first.
From error detection to incident understanding
Traditional monitoring
Error
Alert
Engineer investigates elsewhere
ForgeOps
Alert
Who's affected
What changed
Likely cause, with evidence
Trace, query, and dependency
Resolution
Explore a language
Full setup docs, more examples, and real screenshots of what each client's own reports look like once they're in ForgeOps.
Simple, predictable pricing
Start free, no credit card required, no per-seat pricing. See exactly what's included on every plan.
View plans & pricingViewKnow what broke. Know where to look.
Free plan included, no credit card required. New organizations start with 14 days of Business.
Start FreeStart