Reports
Show how production is really doing, without digging through an incident
How many incidents there were, how long they lasted, how many customers they reached, and whether it's getting better: for one application or all of them, on the page or in your inbox on a schedule.
Something you can take to leadership
A report turns what happened in production into something that can leave the engineering team. For the last 7, 30, or 90 days, for one application or every one together, it answers the questions a director or a VP actually asks: how many incidents did we have, which applications had the most, how quickly were they acknowledged, how long did they stay open, how many customers did they reach, and is any of that improving. Each figure sits next to the same figure for the window before.
That makes the tool easier to stand behind as well. Nobody has to assemble these numbers from memory or from a spreadsheet: they come from the incidents ForgeOps detected and the work your team did on them, and an incident counts as open for as long as its errors were really still elevated. Schedule the report and it arrives without anyone opening the page.
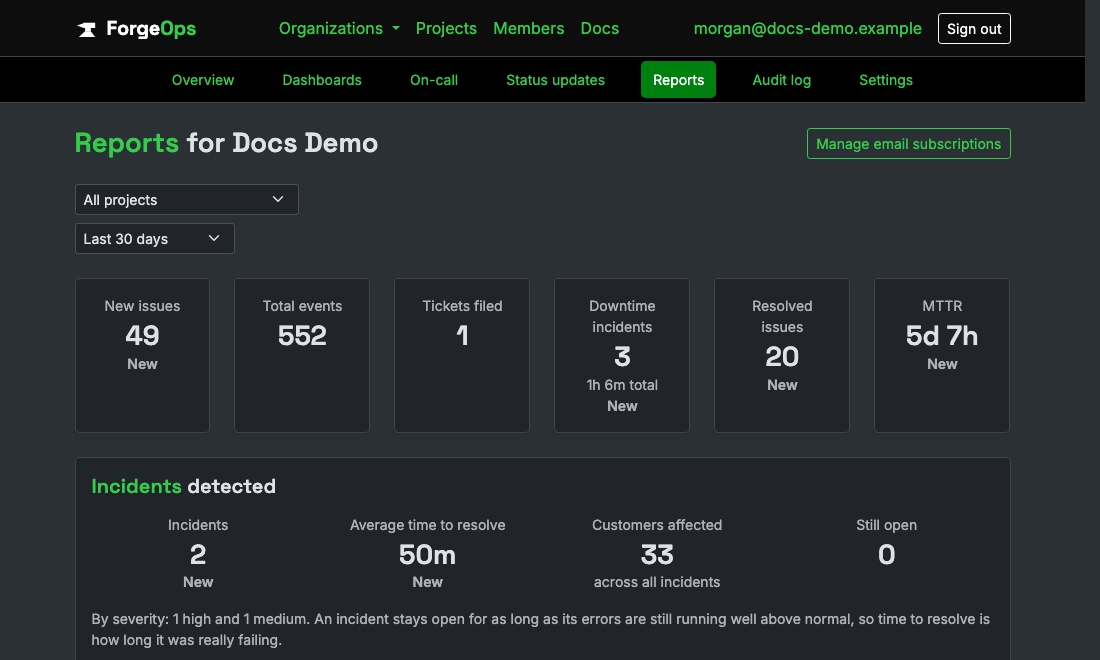
The window's incidents, how long they lasted, and who they reached, beside the window before.
One computation, never two different answers
The on-demand report page and every scheduled email pull from the exact same computation, triggered differently but never able to drift into showing different numbers for the same window: new issues, total events, tickets filed (broken down by provider), incident count and total downtime, and an assignee breakdown covering anyone with at least one occurrence in the window, not just issues first seen in it; an older issue still actively recurring is exactly the kind of thing a director-level overview should surface.
Downtime only ever sums incidents that have actually resolved; one still open at report time counts toward the incident total but has no real end yet to measure against, so it's deliberately left out of the downtime sum rather than guessed at.
Scheduled delivery that can't silently skip a month
A subscription is daily, weekly (a chosen day of the week), or monthly. Monthly delivery is capped at the 28th of the month, not the 31st, on purpose: every month has a 28th, but not every month has a 29th, 30th, or 31st, and "the 31st" silently never firing in February is a much worse surprise than simply not being offered a date past 28 to begin with. Delivery goes to whoever created the subscription; if that account is later removed, the subscription is skipped rather than erroring.
Viewing is Pro and up; scheduling is Business and up
Deliberately not an all-or-nothing wall the way SSO is: a Pro-plan organization can already open the report page and view any date range on demand, real value on its own, before the further upsell of having it land in an inbox on a schedule without anyone opening the page at all.
See it on your own data
Free plan included, no credit card required. New organizations start with 14 days of Business.
Get started freeGet