Uptime monitoring
Catches the failure mode where nothing ever gets the chance to raise
An active check against a real URL, on its own schedule, for the specific case where the app just isn't reachable at all: not something an exception tracker alone can ever see.
The one failure mode nothing else here catches
An Issue means something raised. A missed Heartbeat means a job stopped checking in. Neither one can tell you the app itself just isn't reachable, whether or not anything inside it ever got the chance to raise or report that in the first place; that's what this actively checks for, fetching a real URL on its own schedule rather than waiting to be pinged.
A 2xx or 3xx response counts as up, the same way a browser or load balancer would treat a redirect as reachable; only a 4xx/5xx response, a timeout, or a failed connection counts as a failed check. A single failed check doesn't flip anything on its own: only once consecutive failures cross a real threshold (2, by default) does a monitor actually go down, the same "don't page anyone over one bad request" reasoning a spike notification rule's own threshold already serves for issues.
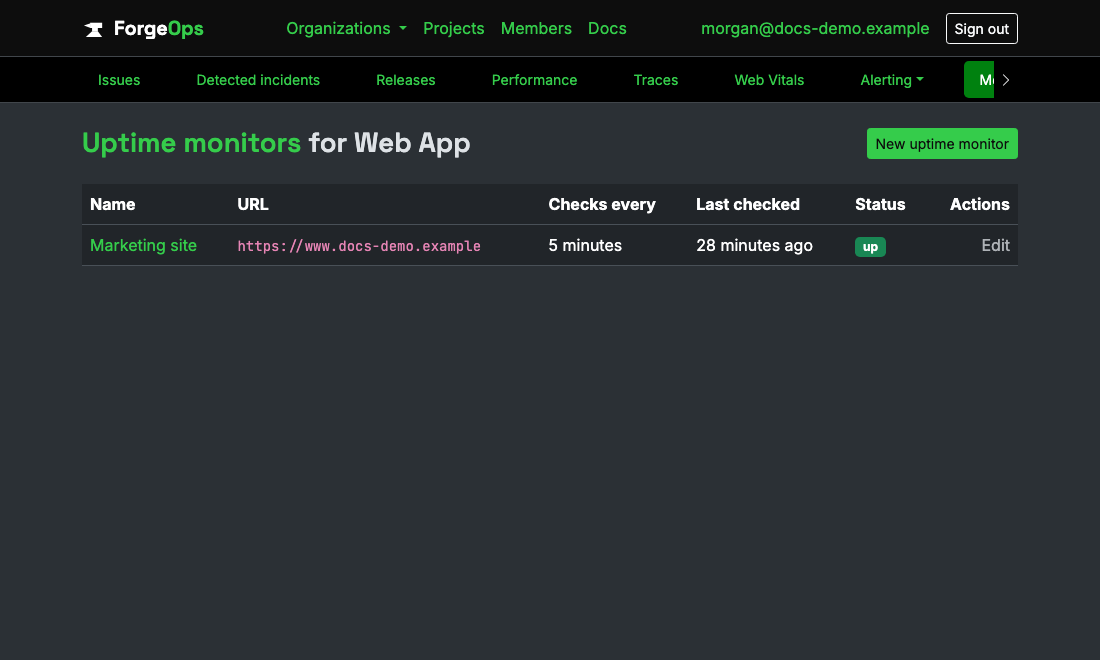
Its own URL, check interval, and failure threshold, same shape as a heartbeat.
Alerts once, recovers on its own
A notification fires only on the transition into down, never repeatedly while it stays that way; a monitor down for six hours produces one alert, not one every time its schedule happens to check again. There's deliberately no separate "recovered" notification either: the moment a real successful check lands, the monitor flips straight back to up and closes its own open incident immediately, bypassing the schedule entirely, so there's nothing left for a later check to observe as "just recovered" and announce.
Checked on its own interval, independently of every other monitor: a one-minute sweep looks at every monitor, but only actually checks the ones whose own interval has actually elapsed since their last check.
Business plan and up
Unlike reporting's own partial tiering, this is all-or-nothing by design: an uptime monitor is a persisted resource with a real, ongoing checking cost behind it, not something with a free on-demand view to offer a lower tier.
A public status page, with email updates for anyone watching
Post a status update (an outage, or a planned maintenance window) and it shows up on your own public status page immediately, with no account needed to see it. Anyone can subscribe there by email too, confirmed with a double opt-in link before anything's actually sent, and can unsubscribe from any update they get afterward.
Posting an update with "Also email every user and status subscribers" checked reaches both audiences in one action: every account on the instance, and every confirmed subscriber, so a heads-up about planned downtime doesn't depend on anyone actually checking the page.
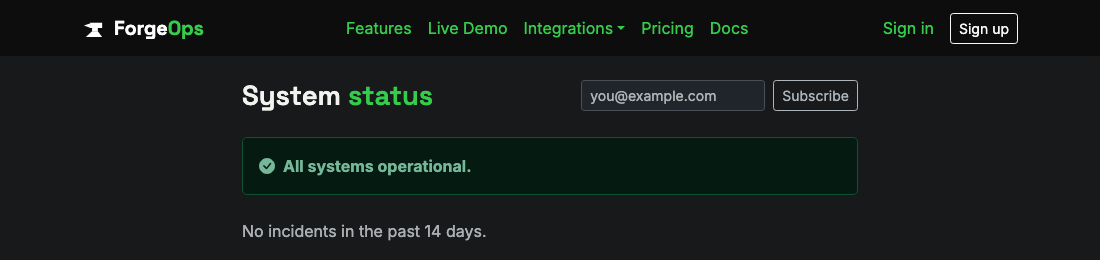
No ForgeOps account needed to see it, or to ask for an email the next time it changes.
An SLA report that shows its own math
Set a target percentage on a monitor and pull a report for any date range, 30, 90, 180, or 365 days back. The report doesn't just total up incident time; every incident is clipped to the exact window requested, so one that started before the range began or is still open past its end only ever counts the portion that actually falls inside it, never the whole incident's duration.
The result is a real uptime percentage for that window, checked against the monitor's own target, in a print-friendly layout built for handing to a customer or forwarding to whoever's asking about a compliance obligation. A step above uptime monitoring itself: Enterprise plan only.
See it on your own data
Free plan included, no credit card required. New organizations start with 14 days of Business.
Get started freeGet