Application Health
Slow is a real incident too, not just down or throwing
Controller/action latency, database queries, background job queues, outbound calls to external services, and a full nested trace of the one request that was actually slow, correlated the same way an error spike already is.
Four panels, one page
Request performance shows p50/p95/p99 per transaction. Database shows a slow-query count (anything over 500ms) and its own p95, plus live connection-pool utilization. Background jobs shows p95 queue-wait latency per queue, color-coded against real thresholds. External services shows p95 per outbound dependency, with a trend arrow against the immediately preceding window, the same comparison an error-rate spike uses.
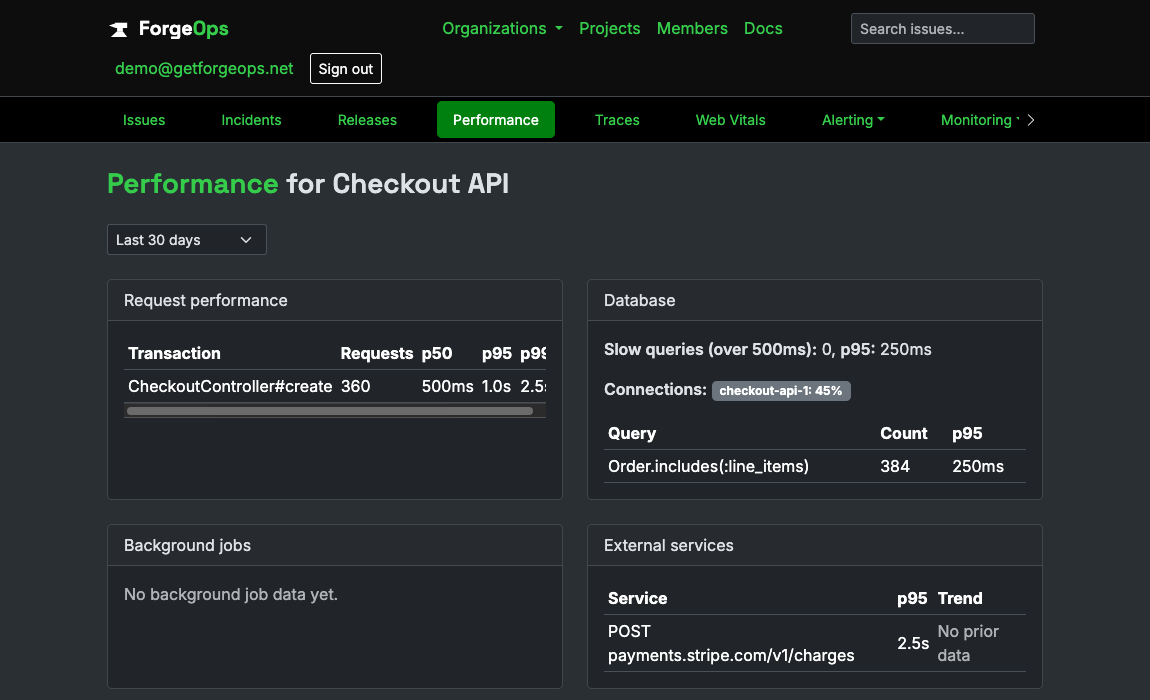
Four panels, each trending against its own immediately preceding window.
A full waterfall for the one request that was actually slow
Beyond the aggregate panels, a captured trace shows one specific request's own nested call tree: the controller action, any service-layer code wrapped by hand, database queries, Redis calls, and outbound HTTP calls, each a real span with its own start time and duration, nested exactly the way the request actually called them.
A trace is only ever captured, let alone sent over the wire, once its own root span's duration crosses a configurable threshold (1 second by default), decided entirely client-side before a single byte leaves the process. A normal, fast request never generates a trace at all; this is built for answering "why was this one request slow," not for recording every request that ever happens.
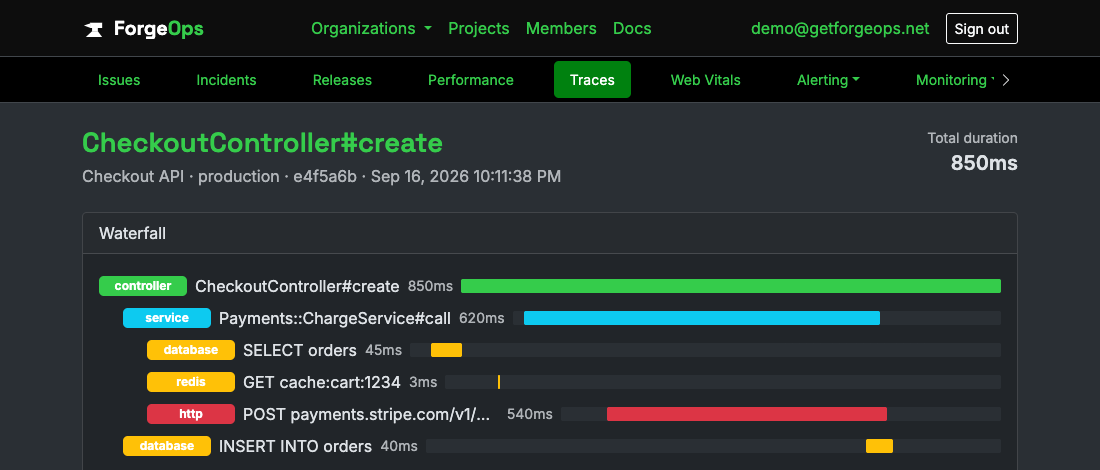
A real nested call tree for the one request that was actually slow.
The same signals Investigation already reads
The external-service and database trend signals an incident correlates onto itself (see Investigation) are the exact same numbers this page renders directly, not a second, separately-computed view of similar-looking data. A degraded external dependency shows up identically whether you're looking at it from the Performance page or from the incident it likely caused.