Custom metrics & infrastructure
Your own numbers, next to the ones ForgeOps already collects
Send any named business metric or a reading from your own servers with one call, then chart it on the same dashboards as your errors and latency.
A business number is one line of code
Nothing about a signup or a payment is something an SDK could detect on its own, so this is an explicit call your own code makes, right where the event happens: capture_metric("signups") for a counter, or capture_metric("revenue", 49.0) for a real amount. A negative value records a refund. Calls are buffered and flushed as one batch in the background, and a failed delivery keeps every entry for the next flush instead of dropping it.
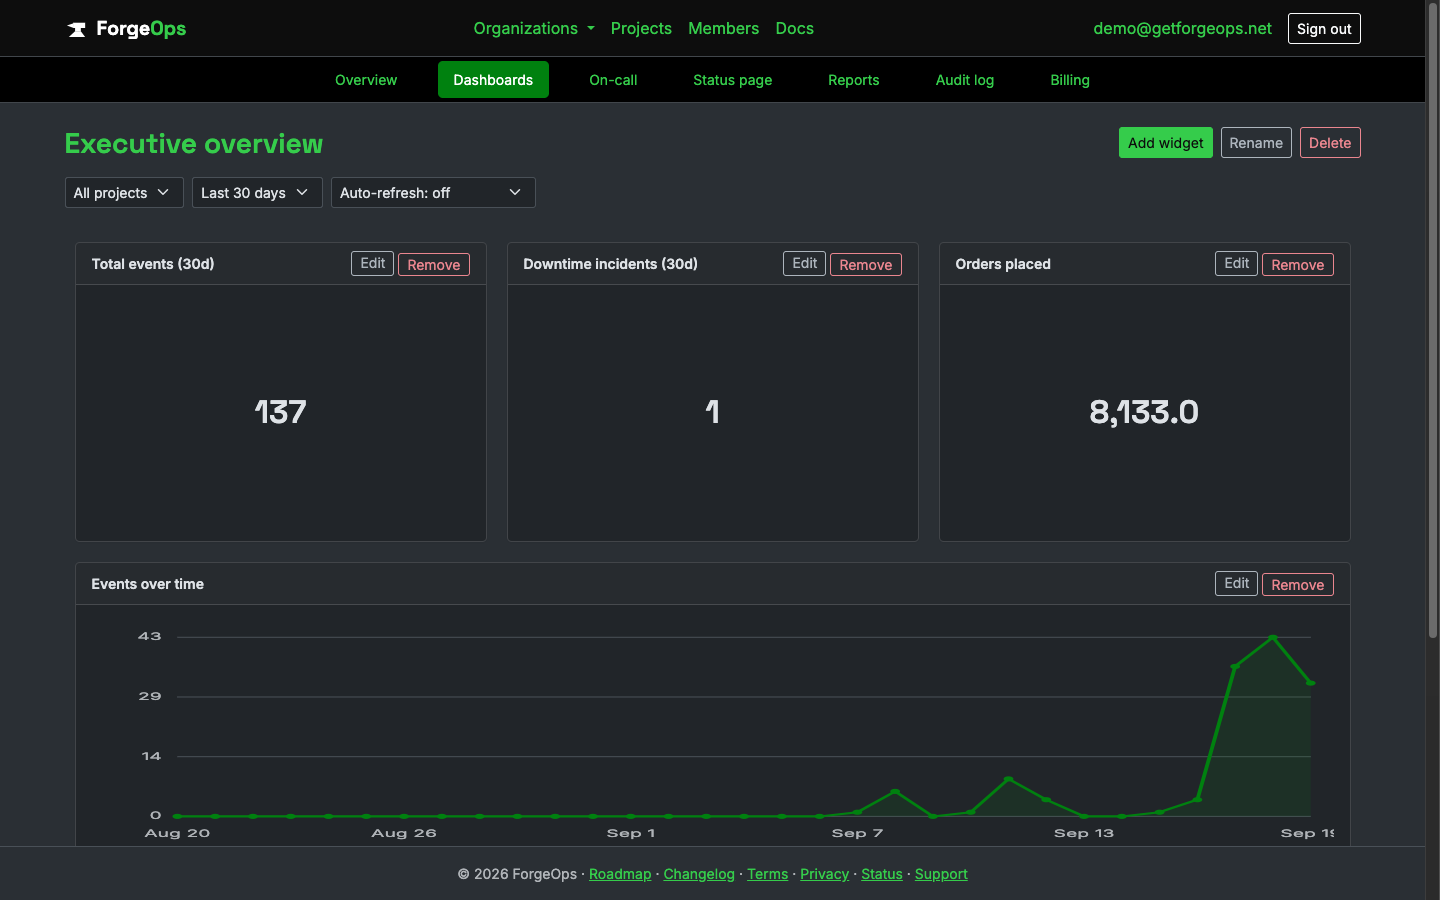
A custom metric (Orders placed) as a dashboard widget beside the built-in ones.
Your servers, on your schedule
Infrastructure monitoring has no ForgeOps-built agent. A short script on a cron entry or a systemd timer reads the host's own load, memory, and disk numbers and reports them with the same SDK your app already uses, tagged with a hostname (the SDK's configured server name by default). A handful of readings in one run still cost a single network request, because the buffer is flushed once on exit.
Charted on the dashboards you already have
Both are data sources in the dashboard builder: a big number summing a revenue metric, a chart of signups over time to watch a launch, or a table of readings grouped by host to spot the one box running hot. They sit next to the error and performance widgets on the same dashboard, so a drop in orders and a spike in exceptions can be read together.