External Services
See the outbound call that's actually slow, not just your own code
p95 per outbound dependency, trending against its own immediately preceding window, the same comparison an error-rate spike already gets.
One panel per dependency you actually call
External services shows p95 per outbound dependency, with a trend arrow against the immediately preceding window, the same comparison an error-rate spike uses. A degraded dependency shows up identically whether you're looking at it from this page or from the incident it likely caused.
The same signal that can name it as the likely cause
External dependency scores proximity times magnitude of a latency spike, with a real corroborating failed call adding a documented bonus on top, never inventing a precise multiplier where there isn't one (see Probable Cause). The exact same outbound call shows up in a captured trace's own nested waterfall too, so the one request that was actually slow and the incident it likely caused are never two separately-computed stories.
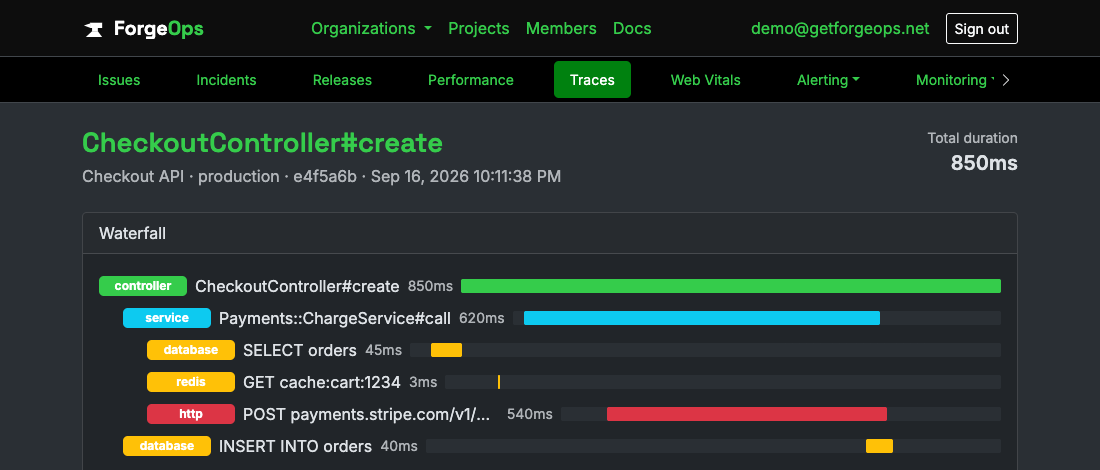
The exact outbound call, in the exact request it slowed down.