SQL in a request
The slowest query in the request, with its plan
An issue opens with the query that took the longest in the request it failed in, how much of the request it cost, and, on PostgreSQL, how the database ran it.
The slowest query, right on the issue
A statement timeout or a slow page rarely says which query was at fault. When the request an issue failed in was traced, the issue opens with its slowest query: how long it took, its share of the request's time, and how many queries the request ran in total. An admin order search that spent 2.7 of its 3.2 seconds on one query says so on the first screen, with the SQL beside it.
When the same statement ran five or more times in that request, the card calls it a likely N+1 and shows the statement, so 24 separate line item lookups read as one problem, not 24 small ones.
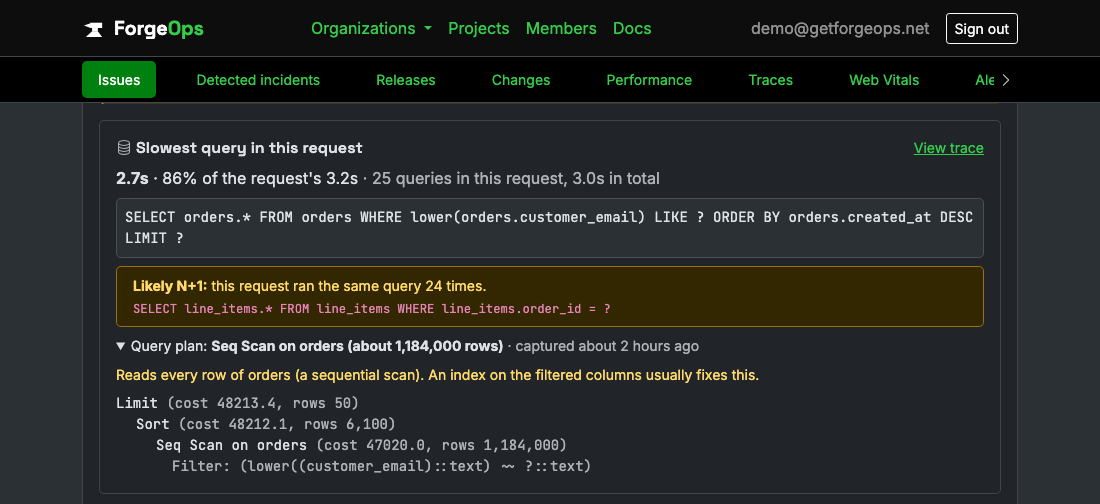
The query behind a statement timeout, with its plan.
SQL on every database span
Every database bar in a trace's waterfall carries the query it ran. Open one to read the full statement and, when there is one, its plan, so a slow trace shows which query was slow, not just that the database was.
The SQL is masked before it leaves your app: every string and number becomes a question mark, so you see the shape of the query, never the values it ran with, and ForgeOps masks it again when it arrives. The Rails, Python (Django and SQLAlchemy), PHP (Laravel), and Elixir (Ecto) SDKs add it to the queries they already time. Every other ForgeOps SDK takes the statement on a database span you create yourself, so all 20 send it.
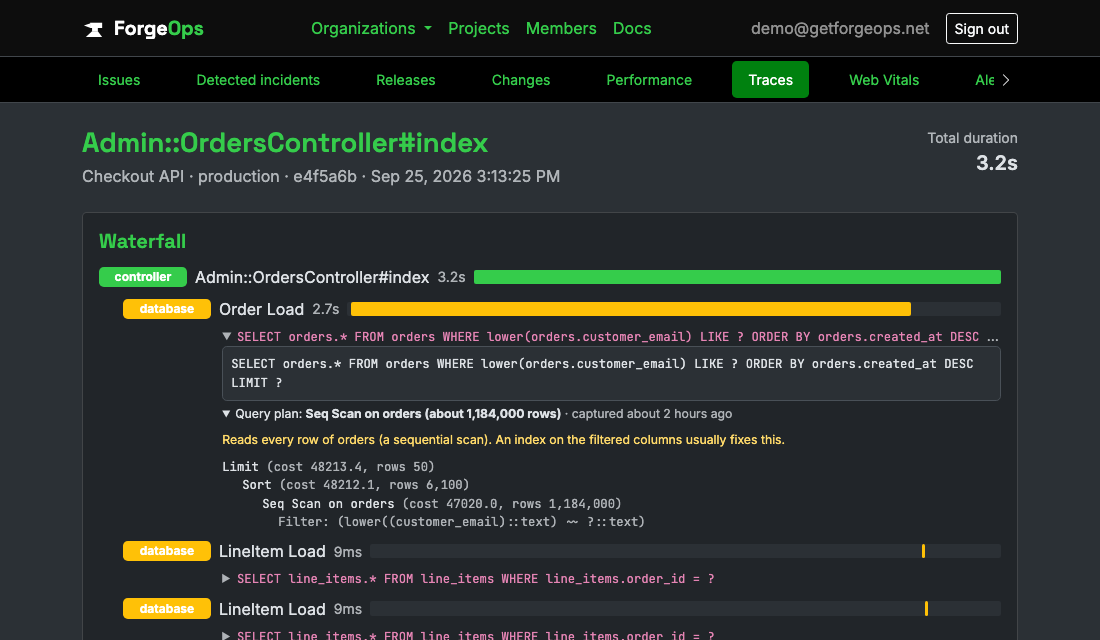
The SQL behind every database bar in the trace.
How PostgreSQL ran it
Turn on explain_slow_queries in the Rails, Python, PHP, or Elixir SDK and a slow SELECT on PostgreSQL gets its plan captured too. The issue shows it beside the query, and a sequential scan over a large table, usually a missing index, is pointed out in plain words above the plan.
It's off by default and careful when on: plain EXPLAIN only, never EXPLAIN ANALYZE, so the query is planned and never run again. Only a single plain SELECT qualifies, on its own connection in a read-only transaction with a two second timeout, off the request, at most once per statement every ten minutes. Values in the plan are masked the same way as the statement. Plans are included on the Business plan and up.